What it really costs to run an agent
Companion code: 18-cost-model
TL;DR
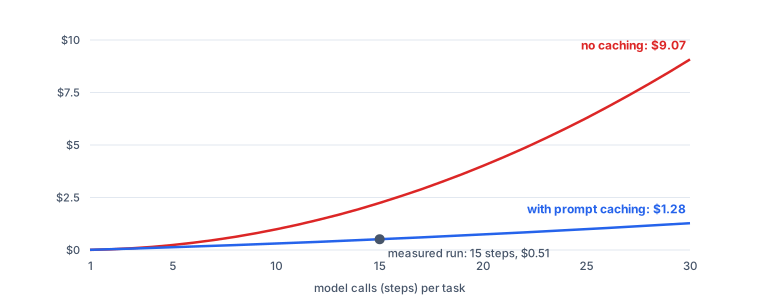
- An agent’s cost is driven less by the price per token than by how many times it re-reads its own context. Every step re-sends everything so far, so without caching, cost grows with the square of the number of steps.
- Five things set the bill: steps per task, how fast the context grows, prompt caching, the model mix, and the success rate. You can estimate all five from traces before you scale.
- A simple model built on those five, checked against a real run, landed within 0.4% of the measured tokens and on the same cost. Use the calculator below for your own workload.
Why agent bills surprise people
A chatbot’s cost is easy to reason about: a question in, an answer out, a predictable number of tokens. An agent is different in one way that matters more than all the others. As post #1 showed, an agent is a loop, and on every step it re-reads its entire context: the instructions, the task, and everything it has done and seen so far.
So the context grows as the agent works, and each step pays for all of it again. Ten steps don’t cost ten times one step. They cost roughly the sum 1 + 2 + 3 + … + 10 times the growth per step. That’s the arithmetic behind most “why is our agent bill so high?” conversations.
A model with five numbers
You can estimate an agent’s cost from five numbers, all of which you can read off your traces (post #15):
| Number | What it is | Where to get it |
|---|---|---|
| Steps | model calls per task | count chat spans per trace |
| Starting context | tokens on the first call: instructions, tool definitions, the task | first call’s input tokens |
| Growth per step | tokens added each step: tool results plus the model’s own output | (last − first input tokens) ÷ steps |
| Caching | whether the repeated part of the context is served from cache | cache-read tokens in usage |
| Success rate | share of tasks finished correctly; failures cost money too | your evals (post #12) |
Add the price list and the arithmetic is short. Total input tokens per task are steps × start + growth × steps × (steps − 1) ÷ 2. With caching and an append-only history, each new token is written to the cache once and read back cheaply on every later step. Divide by the success rate to get the cost per completed task.
Checking it against reality
A model is only useful if it matches what actually happens. Post #3 ran a real agent that read 24 incident reports in 15 steps, and logged the context size at every step. Feeding the model just the first and last context sizes and the step count gives:
| Model | Measured | |
|---|---|---|
| Input tokens read | 548,610 | 546,693 |
| Of which from cache | 476,182 | 474,231 |
| Cost (Claude Opus 5.5) | $0.51 | $0.51 |
Within half a percent. The real context grew almost perfectly linearly, about 5,100 tokens per step, which is why such a simple model works.
The five levers, ranked
Starting from that measured run, here’s what each change does to the cost per completed task:
| Change | Cost | vs. baseline |
|---|---|---|
| baseline (as measured, with caching) | $0.51 | 1.0× |
| turn off prompt caching | $2.24 | 4.4× |
| twice as many steps per task | $1.28 | 2.5× |
| 80% success rate instead of 100% | $0.64 | 1.2× |
| half the context growth per step | $0.29 | 0.6× |
| Sonnet 5.5 instead of Opus 5.5 | $0.30 | 0.6× |
| Haiku 4.5 instead of Opus 5.5 | $0.15 | 0.3× |
1. Caching first. Nothing else comes close. With caching, re-reading the context costs a twentieth of the normal input price, so it’s the difference between a 4× bill and a 1× bill. Caching only works if the start of the context stays the same from step to step. Post #3 showed how to keep it stable, and measured what happens when you don’t: clearing old results too often cost more than keeping them.
2. Steps. Fewer steps per task is the next biggest lever. Good tools (post #4) and workflows instead of open-ended agents where the steps are known (post #2) both cut steps.
3. Growth per step. Every token a tool returns is re-read on every later step. Lean tool responses cut growth directly. In post #4, an agent-shaped tool set reached the same answers with about 14 times fewer tokens.
4. Model mix. A smaller model costs a fraction per token, but only saves money if it still gets the work right. Post #16 measured four strategies. Running the strong model at lower effort cut cost by a third with no loss of accuracy, which makes it the first thing to try.
5. Success rate. Failed tasks are paid for in full, and their retries are paid for again. An agent that succeeds 80% of the time costs 25% more per completed task than its per-attempt price suggests, before counting the human time spent cleaning up.
Estimate your own
List prices per million tokens, October 2026. Model API cost only: no human review, infrastructure or tool costs.
A few rules of thumb when you use it:
- Measure, don’t guess. Take steps, starting context and growth from real traces of a pilot. Guesses are usually too low on steps and much too low on growth.
- Price the whole task, not the call. Include retries, evaluation calls, sub-agents and any verifier (post #8). The calculator covers one agent loop. Multiply by the number of loops a task really runs.
- Model cost is often not the biggest line. Human review, infrastructure, tool and API fees, and engineering time usually exceed the model bill at small scale. They don’t scale with tokens, so they’re easy to forget in a spreadsheet.
Budgets and alarms
Once an agent is in production, cost needs the same controls as any other resource:
- A budget per task. A hard cap on steps or tokens, so a confused agent stops instead of looping. Every harness in this series has one (post #11).
- Alerts on outliers. Watch the distribution of tokens per task, not just the total. The expensive failures are in the tail: runaway loops, a tool that suddenly returns a huge response.
- Cost per completed task as the headline metric. It combines price, efficiency and quality in one number, and it’s the one that maps to business value.
Trade-offs
- The model is deliberately simple. It assumes linear context growth and an append-only history. Agents that compact, clear or delegate (posts #3 and #7) need their loops modelled separately.
- Prices change. The numbers here use list prices from October 2026. The structure (steps, growth, caching, success) holds even when prices don’t.
- Cheapest isn’t best. The goal is the lowest cost per correct result. A model that’s half the price and fails twice as often is a false economy.
Next in the series: Inside a coding agent.
Sources & further reading
- This series’ measured runs: post #3 (context strategies), post #4 (tool design), post #16 (model routing and effort).
- Claude API documentation: pricing and prompt caching.
- Yichao “Peak” Ji, Context Engineering for AI Agents: Lessons from Building Manus (Jul 2025), on cache hit rate as the key production metric.